



How modern Sugar Mills Can Improve Recovery, Steam Efficiency, and Ethanol Yield
How integrated sugar mills can win back recovery, steam and ethanol yield, one connected season at a time.
At a glance
A big season, decided by small margins. ISMA puts 2025–26 net sugar output at about 293 lakh tonnes (+12%), after about 31 lakh tonnes went to ethanol.[1] National average recovery stood at 9.31%, up from 9.09%.[2]
Recovery is the number that pays. Every 0.1 point of recovery on the 2,420 lakh tonnes of cane crushed by mid-February is about 2.4 lakh tonnes of sugar,[2] worth roughly ₹900 crore at an assumed ₹38/kg ex-mill.
The mill is now an energy complex. India reached E20 in 2025, five years early, and ethanol demand is projected to grow from about 1,016 to 1,600 crore litres by 2028.[3] Sugar, power and ethanol share the same cane, the same steam and the same season.
This is why sugar needs an Industrial OS, not a factory OS. The value sits across the field, the yard, the mill, the boiler house, the grid connection and the distillery. Delpheon Industrial OS runs them all on one operating layer.
For a representative 7,500 TCD integrated mill, the modeled prize is about ₹10.3 crore a season from recovery, steam economy, distillery yield and lost time (Exhibit 4).

Why sugar is unlike any other process industry
A sugar mill does a year's business in one crushing season. Its raw material is perishable: cut cane starts losing sucrose from the moment it's harvested. It arrives in thousands of tractor-trolleys and trucks from thousands of farmers. And it feeds three businesses at once: sugar from the boiling house, power from bagasse-fired boilers, and ethanol from molasses or juice.
That makes the mill one tightly coupled system. A queue at the gate becomes staling in the yard, then lower recovery in the pans. A mill stoppage becomes excess steam, then wasted bagasse. A poor boiling becomes higher molasses purity, then a different distillery plan. Most mills still manage each of these handoffs on separate logbooks and spreadsheets.
Exhibit 1 The integrated sugar complex as one connected system

Delpheon illustration. Teal markers show where Industrial OS captures data and supports decisions.
The insight
In sugar, the costliest losses fall between departments: yard to mill, mill to boiler, pan to distillery. Only one connected data model across the whole complex can see them, and fix them while the season is still running.
01 The season is the factory
An Industrial OS for an industrial complex
A factory OS would stop at the mill house. A sugar business doesn't: it begins with harvest permits in thousands of fields, runs through a cane yard, a mill, a boiling house and a lab, and ends at a power grid and an ethanol tanker. Delpheon Industrial OS connects that whole chain, from field to fuel, on one data model, and scales from one mill to a multi-unit group.

02 Recovery is the number that pays
A one-point gap hiding in plain sight
Mid-season data shows recovery of 10.40% in Gujarat and Telangana, 9.90% in Uttar Pradesh and 9.35% in Maharashtra.[2] Cane variety, climate and agronomy explain much of that spread. But inside any one mill, a large share of the losses are operational: cane waiting too long between cut and crush, sucrose left in bagasse and filter cake, molasses not fully exhausted, and "undetermined" losses that nobody owns.
Exhibit 2 Where the sucrose goes
 Delpheon illustration. Values are illustrative for a typical cane mill, for discussion only.
Every slice of that chart is measurable, and every one has an operational lever. The problem is that most mills measure them once a shift on paper, and act on them a day later.
03 Where the value is
Six levers across the integrated complex
1. Cane yard and freshness: crush it before it stales
FROM Trucks and trolleys arrive unscheduled. Queues stretch for hours, weighbridge entries are typed by hand, and nobody knows the cut-to-crush age of the cane being fed to the carrier.
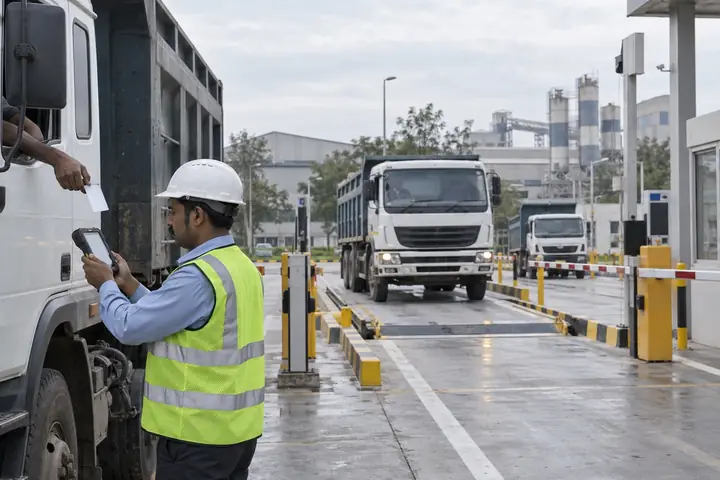
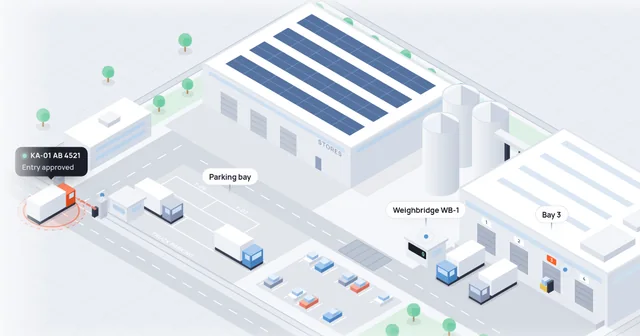
To Gate-to-Dock Logistics gives each harvest permit a QR code, schedules arrival slots by zone and harvest plan, integrates the weighbridge, and tracks every vehicle from gate to tipple. Cane age becomes a live KPI linked to recovery.

2. Mill house and lost time: protect the crush rate
FROM Lost time is recorded in a register at shift end. Chokes, carrier trips, mill drive and turbine faults are lumped together, and the next failure is found when the mill stops.
TO The Industrial Edge captures drive, turbine, carrier and pump signals. Production Execution logs every stoppage with its cause in real time and tracks crush rate against target hour by hour. AI/ML Optimisation flags early warning signs on critical drives.

3. Boiling house control: stop sucrose leaving with molasses
FROM Pan boiling depends on the pan boiler's experience. Massecuite brix, boiling time and purity drop vary by shift, and final molasses purity is only known after the fact.
TO Production Execution holds pan-boiling schemes as recipes, compares each strike with a golden profile, and alerts on drift in brix, vacuum and boiling time. Centrifugal wash and purity drop are tracked strike by strike.

4. Lab and chemical control: hourly truth, not daily averages
FROM Pol, brix and purity samples are analysed by hand and written in the manufacturing report. Errors and delays mean the chief chemist sees yesterday's losses, not today's.
TO Quality Lab Management connects polarimeters, refractometers and moisture analysers, validates results against targets, and pushes pol in bagasse, filter cake and molasses straight to the process dashboard. Losses are visible within the hour.

5. Steam, bagasse and cogeneration: every tonne saved is power sold
FROM Steam % cane is calculated monthly. Boilers, evaporator bodies and turbines are monitored separately, and bagasse balance is a guess until the yard runs low.
TO Energy, Utilities & Emissions meters steam, power and bagasse continuously, tracks steam % cane by shift, diagnoses boilers, compressed air and pumps, and shows the bagasse balance live. Saved bagasse becomes exportable power or a saleable by-product.

6. Distillery and ethanol: the second product line
FROM Fermentation and distillation run on their own logs. Feedstock switches between B-heavy, C-heavy molasses and juice are planned on spreadsheets.
TO Production Execution tracks fermentation batches, efficiency and alcohol yield per tonne of feedstock. Quality Lab Management holds the analysis, and Plant Visibility & Analytics shows sugar and ethanol economics side by side, so feedstock decisions are made on live data.

04 In practice
One screen for the whole complex
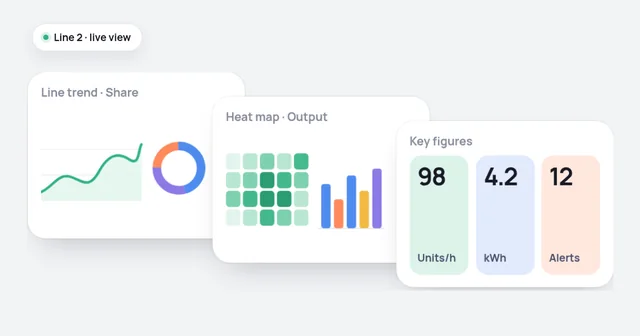
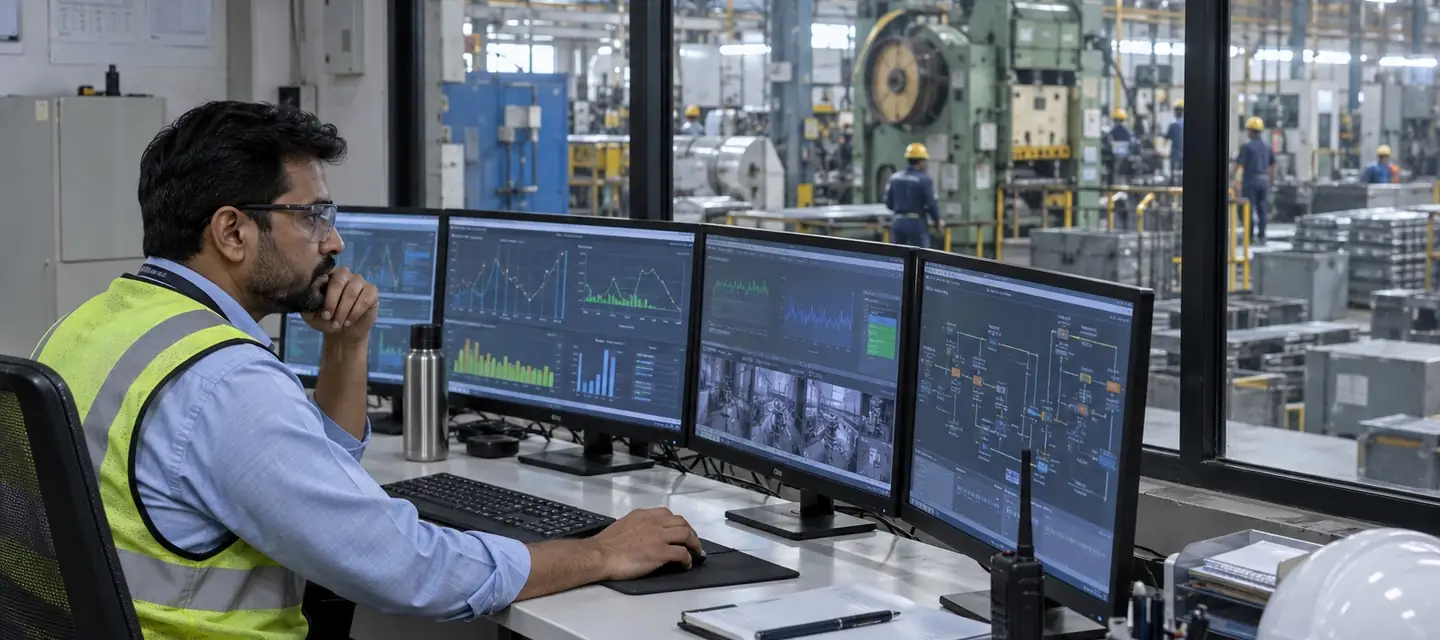
In a mill running Industrial OS, the works manager, chief chemist and chief engineer look at the same live picture. When cane age climbs in the yard, they see recovery dip within hours and can re-sequence harvest permits. When a pan runs long or pol in bagasse drifts, the alert reaches the right person while it can still be fixed.
Exhibit 3 Mill Command Centre (illustrative)
 Illustrative interface with simulated data. Not a client installation
05 The value case
Sizing the prize: a 7,500 TCD integrated mill
We modeled a representative integrated mill: 7,500 tonnes of cane per day over about 140 effective crushing days (around 10.5 lakh tonnes of cane), with bagasse cogeneration and a 120 KLPD distillery. Every assumption is shown so you can replace it with your own.

Modeled estimates for a representative mill, not client results. Prices are assumptions to validate against your own realisations.
Reading the model
Recovery and steam make up two-thirds of the value, and neither needs new equipment. Both depend on seeing losses within the hour rather than the next morning, and on connecting the yard, the boiling house and the boiler house into one picture.
06 The off-season advantage
Use the season's data to plan the off-season
The off-season is when mills overhaul, and it is usually planned from memory and breakdown registers. With a full season of condition data from drives, turbines, pumps and boilers, plus a cause-coded lost-time log, maintenance teams can target the assets that actually cost crush time. They start the next season with fewer surprises.
Season-to-season loop
During the season: capture condition data and cause-coded stoppages. Off-season: prioritise overhaul by lost time and condition. Next season: compare crush rate and lost time against the baseline, and repeat.
07 What leaders should do
Five priorities before the next crushing season
- Make cane age a KPI. Measure cut-to-crush time for every load and link it to recovery. It is often the cheapest recovery point to win.
- Move chemical control from daily to hourly. Connect lab instruments so pol losses in bagasse, filter cake and molasses are seen while they can still be acted on.
- Put steam % cane on the shift board. Track it by shift, alongside crush rate and recovery.
- Run sugar and ethanol as one P&L. Use live recovery, molasses and distillery data to decide feedstock and diversion, not month-end reports.
- Start at the gate and the mill house. Gate-to-Dock and lost-time capture can go live before the season opens and pay back within the same season.
Next step: win back your tenths of a point
- Season loss diagnostic. We size your recovery, steam and lost-time gaps from last season's manufacturing reports.
- Pre-season pilot. We put the gate, weighbridge and mill-house stoppage capture live before the season opens.
- Phased Industrial OS roadmap. We extend to the boiling house, lab, boilers and distillery, with outcome gates your board signs off