


How Chemical Manufacturers Can Reduce Batch Variability and Improve Production Efficiency
How chemical manufacturers can turn batch variability, lab delays and utility losses into yield, throughput and margin.
At a glance
India is a chemicals powerhouse, but much of it still runs on logbooks. The sector is worth about US$250 billion, India is the sixth-largest producer in the world, and exports reached US$20.5 billion in FY26.[1] Yet many batch plants still record recipes, readings and lab results by hand.
Process manufacturing has a different value equation. In chemicals, profit is made or lost in yield, batch cycle time, off-spec material and utilities, not in the part counts and OEE that dominate discrete manufacturing.
The prize is proven. McKinsey estimates that digital and analytics can add 20–30% throughput, 2–5% yield and a 5–10% cut in energy costs in batch processes, on top of earlier improvement programmes.[2]
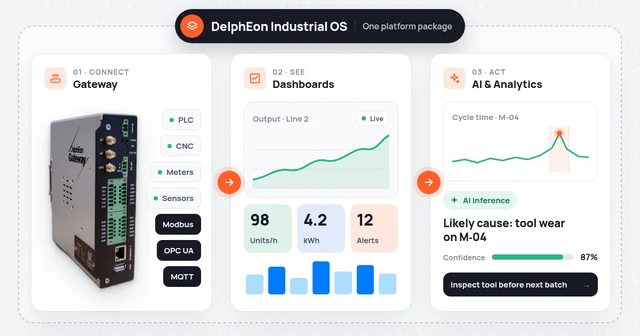
The factory floor is only part of the plant. A chemical site also runs its lab, tank farm, utilities, effluent treatment and tanker gate, and often several sites. Delpheon Industrial OS puts all of them on one operating layer, not just the production line.
Most programmes stall. 72% of companies say their digital transformation stalled before reaching scale.[2] The answer is one operating layer, phased in with outcome gates.
For a representative ₹400 crore specialty chemicals plant, the modeled prize is about ₹9.9 crore a year (about 2.5% of revenue), plus about ₹2.2 crore of working capital released once (Exhibit 4).

01 Why process is different
Chemicals don't count parts. They manage variability.
A discrete plant asks how many good parts it made. A chemical plant asks how much on-spec product it got from each kilogram of raw material, how long each batch took, and how much steam, power and water it used along the way. The physics are continuous, the quality is proven in the lab, and one batch can split into several lots or blend into others.
That is why tools built for discrete manufacturing so often disappoint in chemical plants. Process manufacturing needs a system that understands recipes, phases, batch genealogy and the lab-to-plant loop.
Exhibit 1 What changes when you move from discrete to process manufacturing
 Delpheon analysis
The insight
In chemicals, the biggest gains rarely come from running equipment harder. They come from running every batch like your best batch, and from closing the gap between the lab result and the next decision on the plant floor.
From factory to industrial operation
Why chemicals need an Industrial OS, not a factory OS
A factory OS stops at the plant floor. In a chemical business, most of the value and risk sits outside that boundary: in the QC lab that releases every batch, the boilers and cooling towers that set energy cost per kg, the ETP that decides whether you can run at all, the tank farm and gate where hazardous materials move, and the other sites making the same products to different standards.
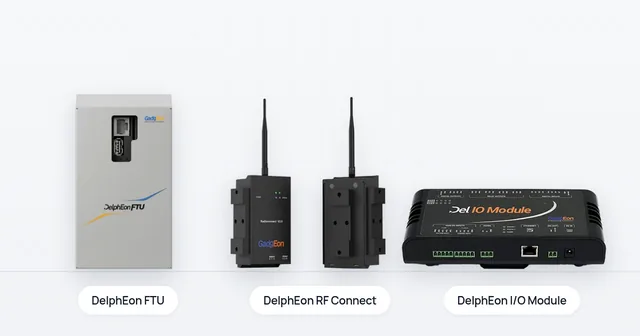
Delpheon Industrial OS is one operating layer for the whole industrial operation. It connects process equipment, labs, utilities, effluent systems and logistics on a single data model, from one reactor to a network of sites.
Exhibit 2 Factory-level tools versus an Industrial OS

02 Where the value is
Seven levers for process excellence
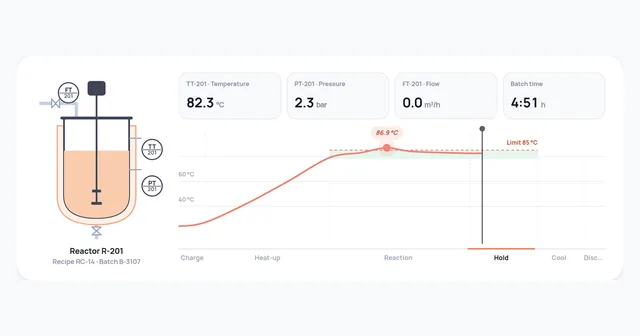
1. Golden batch and recipe enforcement: run every batch like your best
FROM Recipes live in binders and in senior operators' heads. Charging sequences, ramp rates and hold times vary from shift to shift, and so do yields.
TO Production Execution holds master recipes with phase-level parameters, guides operators step by step, enforces critical process parameters, and compares each batch with the "golden batch" profile in real time. Any deviation is recorded against the batch.

2. Batch cycle time: find the hidden hours in every batch
FROM Batch cycle time is known only as an average. Waits for lab results, material, utilities or operators are invisible, and nobody can say which phase is the real bottleneck.
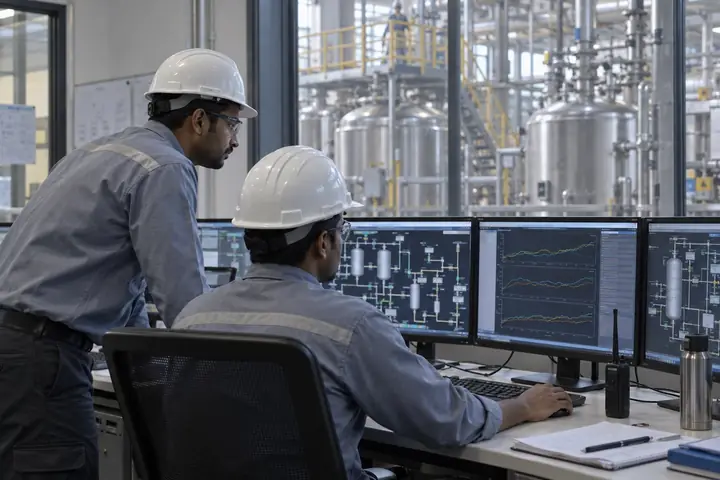
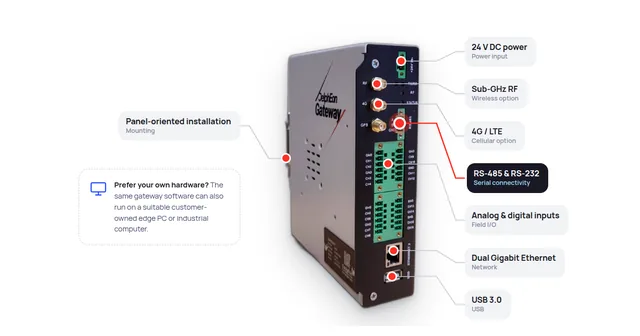
TO The Industrial Edge captures reactor temperatures, pressures, agitator and valve states. Production Execution breaks each batch into phases and timestamps every wait, showing exactly where cycle time goes, batch by batch and reactor by reactor.

3. Lab-to-plant loop: stop batches waiting on paper
FROM In-process samples are walked to the lab, results are typed into spreadsheets and phoned back to the control room. Batches sit on hold, and certificates of analysis take days.
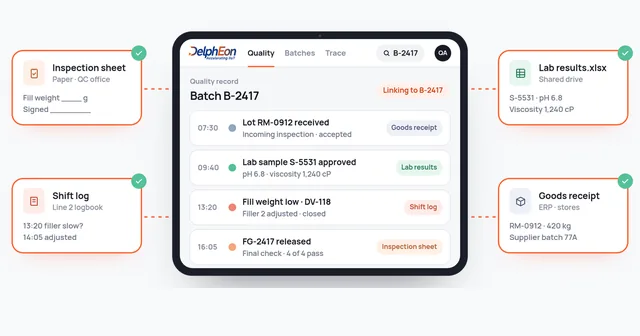
TO Quality Lab Management connects instruments, checks results automatically against specs, and pushes them straight to the batch record. Out-of-spec results trigger alerts and holds, and certificates of analysis are generated automatically.

4. Genealogy across splits, blends and rework
FROM A customer complaint or a supplier recall means days rebuilding which raw material lots went into which batches, and which batches were blended, split or reworked into which dispatches.
TO Production Execution keeps two-way genealogy from incoming raw material lot to batch to blend to finished-goods lot to customer dispatch, linked to every lab result and deviation. This supports customer audits, export documentation and fast, accurate containment.

5. Utilities, energy and effluent: the cost centre nobody owns
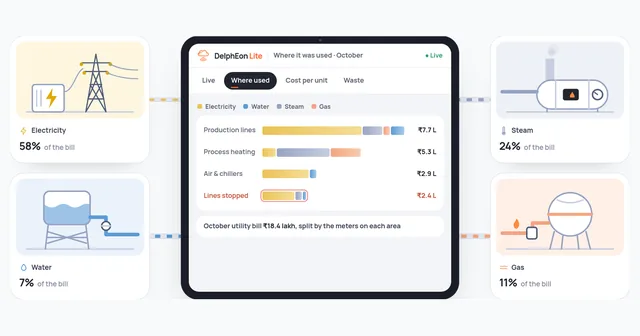
FROM Steam, power, cooling water, compressed air and effluent treatment are big costs, but they are metered at the plant boundary and managed separately from production.
TO Energy, Utilities & Emissions meters utilities by reactor, line and batch, diagnoses boilers, compressed air, AHUs and STP/ETP, and calculates energy and Scope 1 & 2 emissions per kg of product. Utility cost becomes part of batch cost.

6. Reliability of critical assets: protect the bottleneck reactor
FROM Agitators, pumps, compressors and heat exchangers are maintained by calendar. An unplanned failure mid-batch can mean lost material, rework or a safety event, not just lost time.
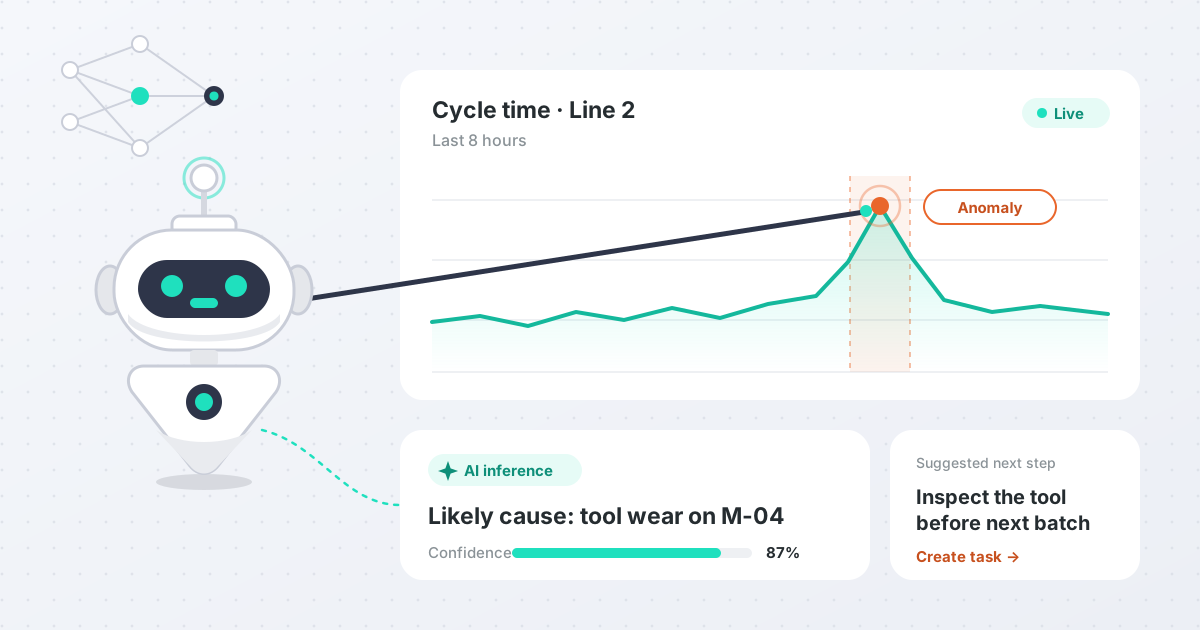
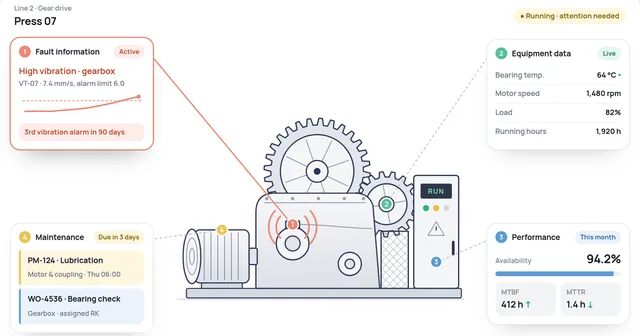
TO Production Execution runs condition-based maintenance from live vibration, temperature, current and pressure data from the Industrial Edge. AI/ML Optimisation spots early signs of failure and fouling so interventions happen between batches.

7. Tanker and raw-material logistics: safer, faster gates
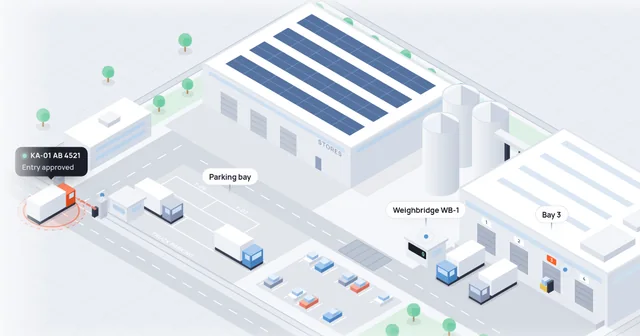
FROM Tankers and drums of raw materials and hazardous goods queue at the gate. Weighbridge entries are typed by hand, and unloading slots don't match the production plan.
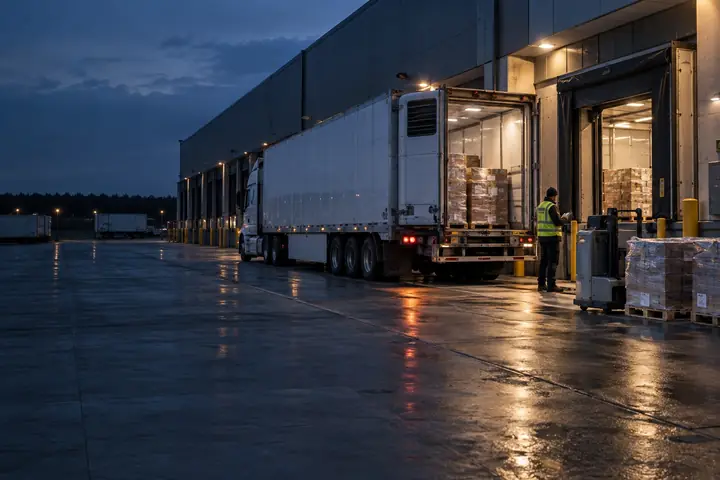
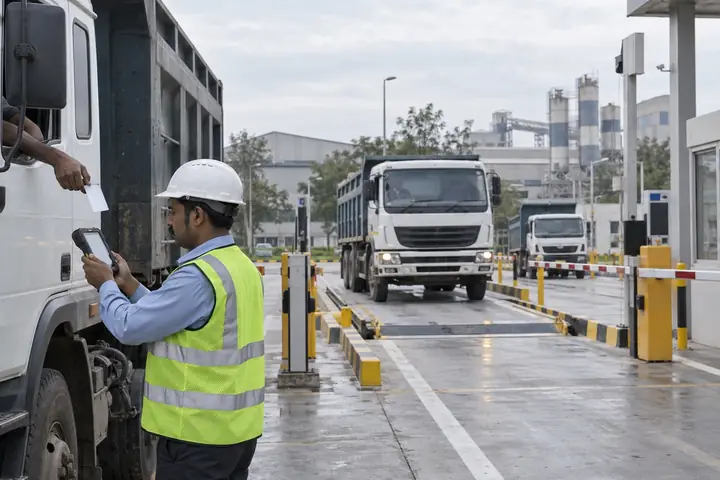
TO Gate-to-Dock Logistics brings QR-based gate access, slot scheduling, weighbridge integration and bay check-in/out. Inbound tankers are sequenced by what the next batches need, and every movement is recorded for compliance.

A note on the benchmarks
McKinsey, EIA and ABB figures describe industry-wide potential or other companies' results. They are not Delpheon results. Delpheon-reported figures come from Delpheon product documentation. Use both to size ambition, then validate against your own baseline.
03 Avoiding pilot purgatory
Why 72% stall, and how to be in the other 28%
McKinsey found that 72% of companies saw their digital transformation stall before reaching scale.[2] In chemical plants the pattern is familiar: a successful analytics pilot on one reactor, with no way to repeat it, because the data foundation, recipes and lab integration were never built.
Exhibit 3 A phased path with outcome gates

04 The value case
Sizing the prize: a ₹400 crore specialty chemicals plant
We modeled a representative Indian specialty chemicals manufacturer: ₹400 crore revenue, multi-product batch reactors, about 2,000 batches a year, with raw materials at about 60% of revenue. Every assumption is shown so you can replace it with your own.
Exhibit 4 Modeled annual value for a ₹400 crore batch chemicals plant

Modeled estimates for a representative plant, not client results. Benchmarks are applied at or below the published ranges.
Reading the model
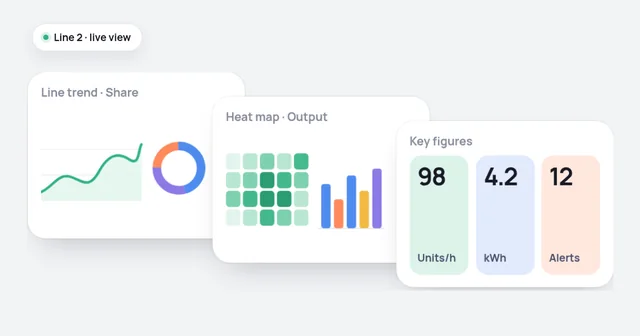
Yield and cycle time account for three-quarters of the value. Neither needs new reactors. Both need recipes that are enforced, batch phases that are visible, and lab results that reach the plant floor in minutes, not hours.
05 Where do you stand?
A process-plant readiness check
Exhibit 5 Process manufacturing maturity scale

06 What leaders should do
Five priorities for chemical plant leadership
- Measure yield and cycle time by batch, not by month. Monthly averages hide the gap between your best and worst batches, and that gap is the opportunity.
- Define and enforce your golden batch. Capture the parameter profile of your best batches and guide every shift to it.
- Connect the lab to the plant. Lab turnaround is often the largest single wait in a batch cycle and the slowest step in finished-goods release.
- Put utilities on the batch cost sheet. Steam, power and water per kg should sit next to raw material cost per kg.
- Scale on one foundation. Avoid isolated pilots. Build each phase on the same data model so the gains carry across reactors, products and sites.
Next step: claim your process advantage
- Batch performance diagnostic. Using your existing batch and lab records, we size the yield, cycle-time and utility gaps for one product family.
- Bottleneck reactor pilot. We connect your constraint reactor and its utilities and show phase-level losses within weeks.
- Phased Industrial OS roadmap. Each phase has an outcome gate that your CFO signs off before the next one starts.