











Challenge 01
High Energy & Steam Demand
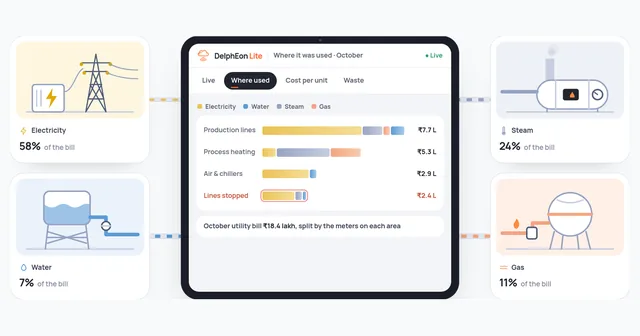
Steam and electricity consumption have a significant impact on operating efficiency and costs.
“Why did PM-2 use more steam per tonne this week?”Energy manager
Pulp & Paper
Pulp and paper manufacturing depends on stable processes, reliable equipment, and efficient utility consumption. DelphEon helps manufacturers monitor operating conditions, track production performance, and understand how resources are used across the plant.
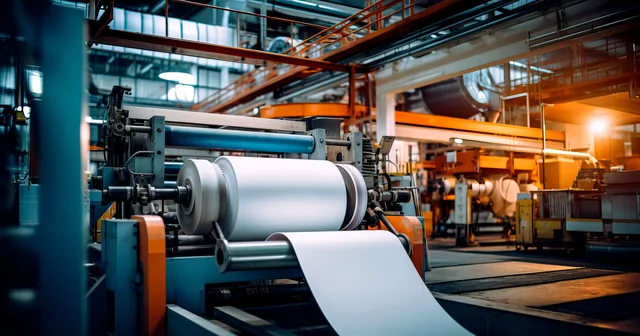
Scroll to watch:Shown here: Making paper on machine PM-2
PM-2 · Paper machine
Every reel, with the steam, power and water behind it.
Steam and electricity consumption have a significant impact on operating efficiency and costs.
“Why did PM-2 use more steam per tonne this week?”Energy manager
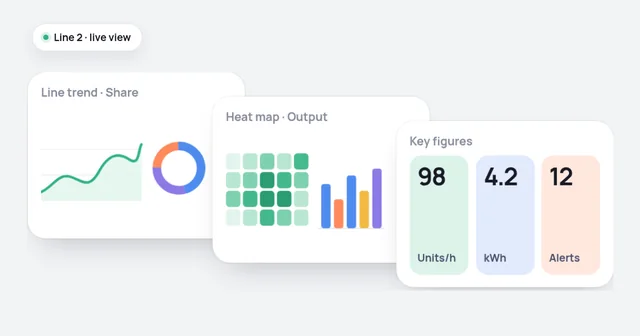
Monitor electricity, steam, and other utility consumption against relevant production measures to identify inefficiencies and unusual usage patterns.
On PM-2PM-2 used 2.74 t of steam per tonne of paper in week 42, against 2.45 t in week 41 at almost the same output.
Key measureskWh/Ton·Steam/Ton·Energy Demand
Explore Utilities & Cost AnalyticsMonitoring water usage across processing stages is essential for understanding consumption efficiency.
“Where is our fresh water going, stage by stage?”Utilities manager
Track relevant process parameters, equipment conditions, and operating trends across pulp preparation, stock processing, and paper production.
On PM-2Fresh-water flow to PM-2 stock preparation rose by 18% after a shower setting change, and was flagged as a deviation.
Key measuresProcess Parameters·Operating Trends·Deviations
Explore Process Monitoring & Batch ManagementChanges in operating conditions can influence paper quality, throughput, and production consistency.
“Why does PM-2 make less paper on the night shift?”Production manager
Track production output, operating periods, and relevant process variations to investigate throughput losses and changes in manufacturing efficiency.
On PM-2PM-2 made 8% less paper on night shifts last week, with two sheet breaks and a lower machine speed recorded.
Key measuresProduction Output·Throughput·Process Downtime
Explore Shop Floor ExecutionUnexpected failures in critical equipment can interrupt production and affect process continuity.
“Why has the refiner drive tripped three times this month?”Maintenance head
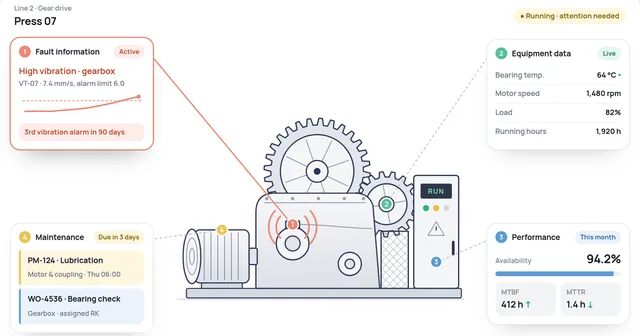
Monitor equipment status, recurring faults, and maintenance information to understand interruptions affecting pumps, drives, and other critical machinery.
On PM-2The refiner drive tripped three times this month. Its MTBF is down to 210 h, with an MTTR of 55 minutes.
Key measuresEquipment Availability·MTBF·MTTR
Explore Asset Maintenance01 / 04
Stage by stage
One view from pulping to the finished reel, built around the stages a pulp and paper mill actually runs.
Pulper loads and consistency logged by hand
Pulper loads, consistency and run time for every shift.
Refiner settings changed without a record
Refiner load, flow and consistency trends, with deviations flagged.
Breaks and speed changes noted in the shift log
Machine speed, sheet breaks and production by grade and shift.
Steam pressures read off local gauges
Dryer steam use and condensate return trends, where metered.
Reel weights totalled at the end of the shift
Reel output and winder stoppages by shift.
Boiler and water meter readings once a day
Steam, electricity and water consumption per tonne of paper.
Two weeks, compared
Two production periods may deliver similar output but consume different amounts of steam, electricity, or water.
DelphEon helps manufacturers connect available utility measurements with production data to compare specific consumption and investigate efficiency variations.
Steam used by PM-2 across the week
Week 412,940 tWeek 423,260 t
Paper made in the same week
Week 411,200 tWeek 421,190 t
Steam per tonne of paper
Week 412.45 tWeek 422.74 t
Condensate return from the dryer section, now reviewed
Week 4182%Week 4268%
Getting started
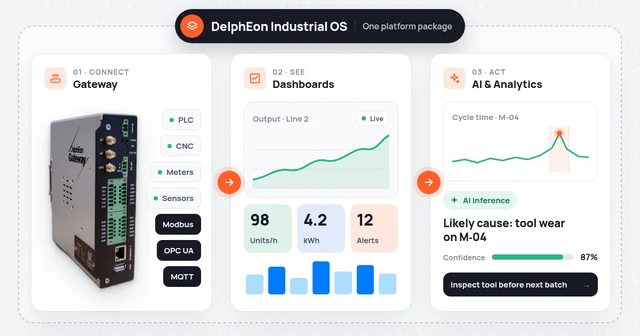
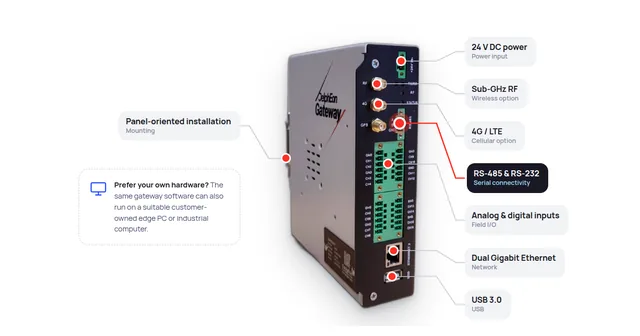
DCS, PLCs, drives and meters connect through DelphEon Gateway using OPC UA, Modbus, S7 or MELSEC, or through I/O signals where there is no controller interface.
Begin with one paper machine and its steam, power and water meters, and compare its specific consumption week by week.
Add machines, pulping lines and utilities once the first machine’s records are trusted. Your ERP keeps its existing responsibilities.
FAQ
Where the DCS or PLC exposes data through a supported interface such as OPC UA or Modbus, DelphEon Gateway can read process parameters from it. DelphEon is used to monitor and record; process control stays with your DCS and operators. Each system is assessed during scoping.
Yes, where utility meters and production output are available. Meters with a usable output, such as Modbus or pulse signals, connect through DelphEon Gateway, and consumption is shown against production, for example steam or water per tonne. Missing meters are identified during scoping.
No. DelphEon works alongside them. Process control stays with the DCS, and which system owns orders, stock and maintenance records is agreed during scoping.
With one paper machine and its steam, power and water meters. The aim is a trusted per-tonne view for that machine before you expand.
Connect process performance, production information, and utility consumption to identify opportunities for improved efficiency and operational reliability.
Discuss Your Pulp & Paper Manufacturing Requirements