






Challenge 01
Machine Stoppages & Efficiency Losses
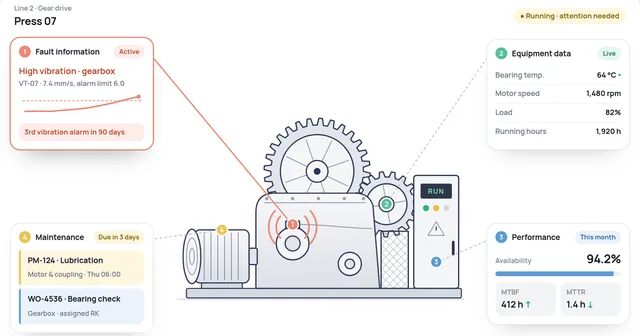
Frequent interruptions and equipment performance variations can affect production output.
“Why did loom efficiency drop to 81% on the night shift?”Weaving manager
Textile Manufacturing
From spinning and weaving to dyeing and finishing, textile manufacturing demands reliable equipment, consistent processing, and efficient resource utilization. DelphEon helps manufacturers monitor performance and understand operational variations across production stages.
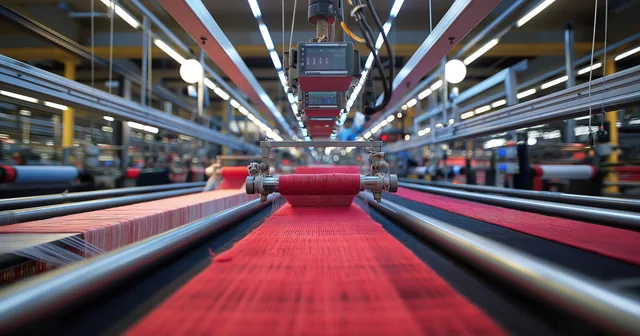
Scroll to watch:Shown here: A weaving loom turning warp yarn into denim
Mill 1 · Loom L-42
One record from the warp beam to the finished roll.
Frequent interruptions and equipment performance variations can affect production output.
“Why did loom efficiency drop to 81% on the night shift?”Weaving manager
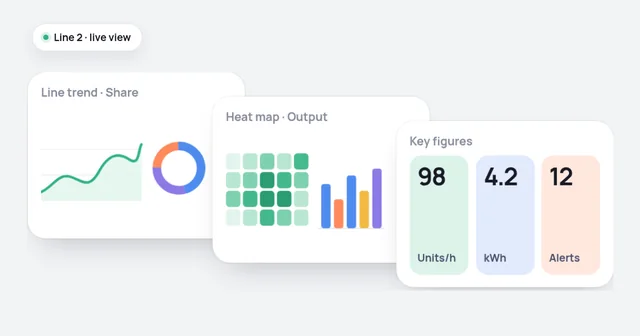
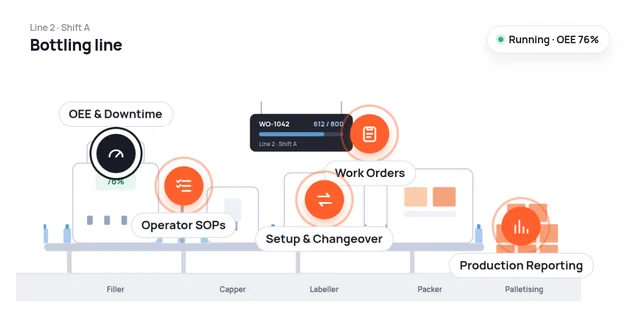
Monitor operating status, downtime, and production performance across spinning, weaving, and other textile manufacturing equipment.
In Mill 1Shed B looms ran at 81% efficiency on the night shift against 88% on days, with warp breaks the top stop reason.
Key measuresMachine Utilization·Downtime·Production Output
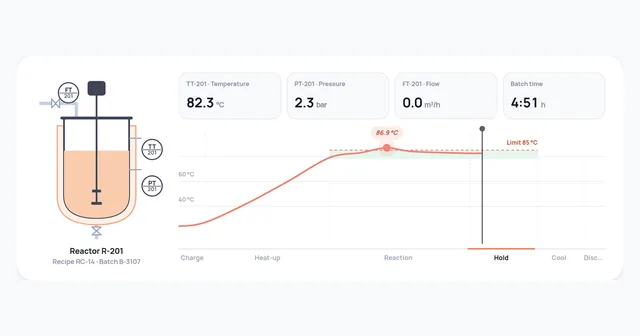
Explore Shop Floor ExecutionVariations in dyeing, processing time, and operating conditions can influence product consistency.
“Why did DL-5121 need a shade correction when DL-5120 didn’t?”Dye house manager
Track temperature, processing duration, and other relevant conditions to understand deviations and compare manufacturing batches.
In Mill 1DL-5121 held at 130 °C for 6 minutes less than DL-5120 on the same recipe, and needed a shade correction.
Key measuresProcess Temperature·Batch Duration·Deviations
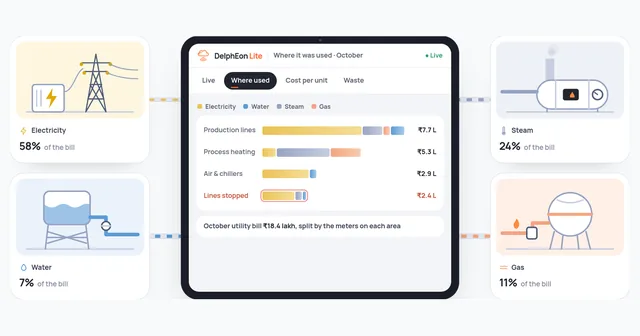
Explore Process Monitoring & Batch ManagementElectricity, steam, and water usage significantly affect manufacturing efficiency and operating costs.
“How much water and steam does each kilo of fabric take?”Engineering manager
Analyze electricity, steam, and water usage against relevant production measures to identify unusual consumption and efficiency variations.
In Mill 1The dye house used 62 L of water per kg of fabric this week, against 55 L the week before.
Key measureskWh/kg·Water/kg·Steam Consumption
Explore Utilities & Cost AnalyticsProduction quantities, process information, and quality records may be maintained across separate systems.
“Which dye lot and looms did this rejected roll come from?”Quality head
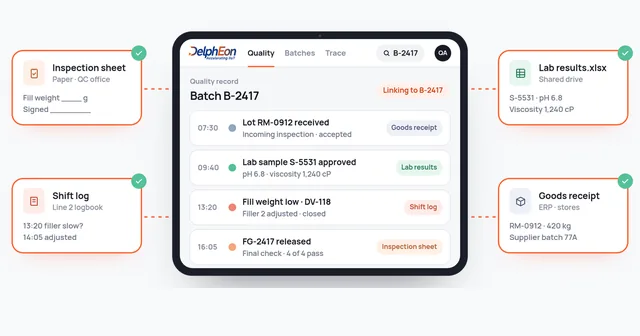
Bring together available production quantities, batch or lot information, and inspection results to improve manufacturing visibility and quality reviews.
In Mill 1Start from rejected roll R-2207 and find its dye batch DL-5121, the looms that wove it and its inspection results.
Key measuresProduction Output·Lot History·Quality Results
Explore Quality Management & Traceability01 / 04
Stage by stage
One view from spinning to packed fabric, built around the stages a textile mill actually runs.
Frame stoppages counted at the end of the shift
Machine status, stop reasons and output for every frame.
Loom efficiency worked out the next day
Loom status, stop reasons and efficiency by shift.
Temperature charts filed with the batch card
Temperature, hold times and deviations for every dye batch.
Stenter settings noted on paper
Stenter temperature, speed and run time by lot.
Fabric defects logged in a register
Inspection results linked to the roll, lot and dye batch.
Meter readings taken once a day
Electricity, steam and water consumption per kg of output.
Two dye batches, compared
Two textile batches may use similar materials and processing procedures but deliver different results.
DelphEon helps teams compare recorded operating conditions, processing durations, and available quality information to investigate variations.
Same recipe and shade, same fabric
DL-5120600 kgDL-5121600 kg
Hold time at 130 °C
DL-512045 minDL-512139 min
Temperature deviations during the hold
DL-51200DL-51212
Shade difference from the standard (ΔE)
DL-51200.6DL-51211.4
Getting started
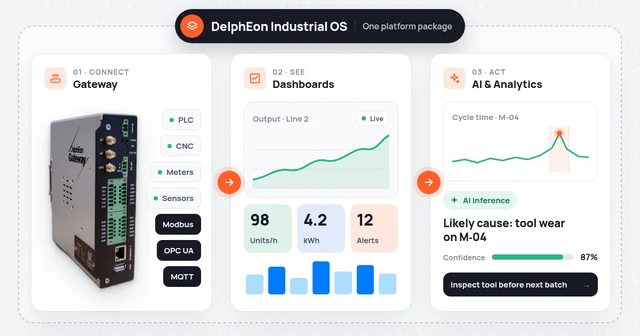
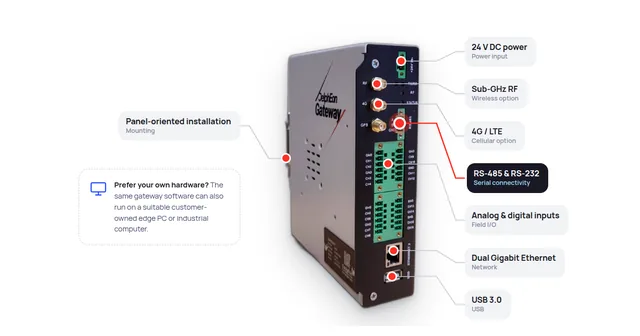
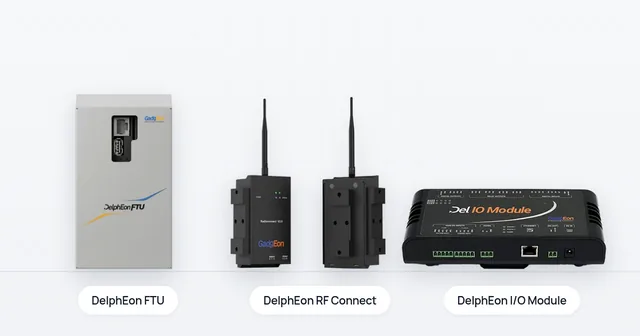
Looms, frames, dyeing machines and meters connect through DelphEon Gateway using OPC UA, Modbus, S7 or MELSEC, or through I/O signals where there is no controller interface.
Begin with one weaving shed or the dye house, with its utility meters, and compare its shifts or batches.
Add sheds, processes and plants once the first area’s records are trusted. Your ERP keeps its existing responsibilities.
FAQ
Machines with a controller interface connect through DelphEon Gateway using protocols such as OPC UA, Modbus, S7 or MELSEC. Older machines without a usable interface can be connected through I/O signals such as run, stop and count. Each machine is assessed during scoping.
Yes. Where dyeing machines record temperature and time, DelphEon keeps a record for each batch, so runs on the same recipe can be compared alongside their deviations and available quality results.
Yes, where utility meters and production quantities are available. Meters with a usable output, such as Modbus or pulse signals, connect through DelphEon Gateway, and consumption is shown against output, for example water per kg. Missing meters are identified during scoping.
With one weaving shed or the dye house and its utility meters. The aim is a trusted record for that area before you expand.
Connect machine performance, process conditions, production records, and utility consumption to support more consistent and efficient textile manufacturing.
Discuss Your Textile Manufacturing Requirements