









See what your utilities really cost.

DelphEon ties electricity, water, steam and gas consumption to production output, so you can see where utilities go, what they cost per unit and where they are wasted.

Electricity

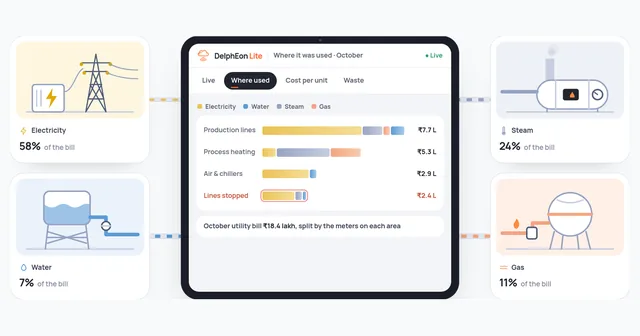
1,284 kW now 58% of the bill ₹8.5 / kWh ₹1.84 L wasted

Water

18.2 m³/h now 7% of the bill ₹40 / m³ ₹0.18 L wasted

Steam

4.6 t/h now 24% of the bill ₹890 / t ₹0.37 L wasted

Gas

212 Nm³/h now 11% of the bill ₹50 / Nm³ No idle use

DelphEon LiteUtilities · live · Plant 1Where it was used · OctoberCost per unit · OctoberUsed with the lines stopped · October● Live

Electricity

1,284 kWMain incomer

Water

18.2 m³/hBorewell + municipal

Steam

4.6 t/hBoiler 1 header

Gas

212 Nm³/hDryers and boiler

Electrical demand · todayPeak 1,540 kVA at 10:00

46 of 48 meters reporting · updated every minute

  • Electricity
  • Water
  • Steam
  • Gas
  • Production lines₹7.7 L
  • Process heating₹5.3 L
  • Air & chillers₹2.9 L
  • Lines stopped₹2.4 L

October utility bill ₹18.4 lakh, split by the meters on each area

  • Utility · usedPer unitCost
  • Electricity125,900 kWh₹8.5 / kWh₹10.7 L
  • Water3,250 m³₹40 / m³₹1.3 L
  • Steam494 t₹890 / t₹4.4 L
  • Gas4,000 Nm³₹50 / Nm³₹2.0 L
Utility cost per tonne₹5,935₹18.4 lakh ÷ 310 t produced
Used while the lines were stopped₹2.4 lakh13% of October's utility bill
  • Electricity ₹1.84 L
  • Water ₹0.18 L
  • Steam ₹0.37 L
  • Compressor C-2 ran 01:40–05:10Lines stopped · about ₹7,600 a night
  • Line 2 steam above range1.9 t per tonne against 1.6 expected

Illustrative figures

The challenge

When utility consumption is visible only in bills, opportunities go unnoticed.

  • Limited Consumption Visibility

    Utility usage across equipment, production lines, and plant areas is not always available in a consolidated view.

  • Unexplained Consumption & Demand

    Sudden increases, abnormal consumption patterns, and demand peaks can go unnoticed without continuous monitoring and analysis.

  • Disconnected Production & Cost Data

    Utility consumption, production output, and cost information are often maintained separately, making it difficult to evaluate efficiency and operating expenses.

How DelphEon helps

Connect utility consumption with operational performance.

DelphEon brings utility measurements and relevant operational information into a common environment, helping manufacturers understand consumption patterns, evaluate efficiency, and identify opportunities for improvement.

Key capabilities

From utility monitoring to consumption and cost intelligence.

01 · Meters and readings

Electricity & Utility Monitoring

Gain visibility into utility consumption across your manufacturing facility.

Monitor electricity, water, steam, gas, compressed air, and other relevant utilities through connected meters and measurement systems. Track current readings, accumulated consumption, and historical usage across equipment, production lines, departments, and plant locations.

Bring multiple utility measurements into a common view to understand consumption patterns and identify areas requiring attention.

02 · Electrical demand

Demand & Power Quality Monitoring

Understand electrical demand patterns and operating conditions.

Monitor relevant electrical parameters, including demand, voltage, current, power factor, and other measurements available from connected meters. Analyze peak-demand periods, load variations, and usage trends to understand how electricity requirements change during operations.

Where suitable power-quality measurements are available, review associated electrical parameters to support investigations into supply and equipment operating conditions.

03 · Consumption per unit produced

Specific Consumption & Efficiency

Understand how efficiently utilities are used relative to production.

Relate utility consumption to production output, operating hours, or other relevant operational measures to calculate specific consumption indicators.

Track measures such as kWh per tonne, water consumption per unit produced, or steam consumption per tonne of output, depending on the manufacturing process.

Compare consumption efficiency across shifts, production periods, equipment, or plant areas to identify variations and opportunities for improvement.

  • kWhper tonne
  • m³water per unit
  • tsteam per tonne
04 · Consumption in rupees

Utility Cost Analysis

Understand the financial impact of utility consumption.

Translate measured consumption into estimated utility costs using applicable tariff information and configured cost calculations.

Analyze utility expenditure across different consumption sources, operating periods, departments, or production areas where the necessary metering and allocation data is available.

Compare consumption and associated costs to identify high-cost operations and support more informed utility management decisions.

05 · Exceptions and reviews

Consumption Deviations & Reporting

Identify unusual usage and simplify utility performance reviews.

Monitor consumption trends and identify deviations from defined operating thresholds, expected ranges, or historical patterns. Review unexpected increases, unusual consumption during non-production periods, and recurring usage variations that may indicate inefficiencies.

Generate utility consumption summaries and reports to support periodic reviews, performance comparisons, and operational improvement initiatives.

Beyond utility monitoring

Consumption tells you how much. Context tells you why it matters.

By connecting utility measurements with operating context, manufacturers gain a clearer understanding of what drives consumption and where improvement opportunities may exist.

One reading, four contexts

Consumption Visibility31%of plant electricity
Operational Efficiency484 kWh/tagainst a 390 target
Consumption Deviations1,120 kWhused with the lines stopped
Cost Visibility₹2.88 Lat the applicable tariff
Shift C · October39,200 kWhElectricity, as the meter reads it
Illustrative figures. What each context can show depends on the meters, production records and tariff information available.
  • Consumption Visibility

    Understand how electricity, water, steam, gas, and other utilities are used across the facility.

  • Operational Efficiency

    Compare consumption against production output and relevant operating conditions to evaluate efficiency.

  • Consumption Deviations

    Identify unusual patterns, unexpected increases, and recurring variations that require investigation.

  • Cost Visibility

    Relate utility usage to applicable cost information to support operating-expense analysis and improvement planning.

Business benefits

Make utility consumption more visible, measurable, and manageable.

Linking utility readings to production and cost shows where consumption goes and where it can come down.

  • Better Utility Visibility

    Monitor the consumption of multiple utilities across equipment, departments, and plant locations through connected operational views.

  • Improved Consumption Efficiency

    Understand utility usage relative to production output and identify areas where consumption efficiency can be improved.

  • Early Identification of Inefficiencies

    Detect unusual consumption patterns, unexpected increases, and potential wastage that may otherwise remain unnoticed.

  • Greater Cost Transparency

    Understand the contribution of different utilities and operating areas to overall utility expenditure.

  • Reduced Manual Reporting

    Automate the collection and consolidation of utility information to simplify routine monitoring, analysis, and reporting.

Take control of utility consumption and operating costs.

From electricity and utility monitoring to specific consumption, demand analysis, and cost visibility, DelphEon helps manufacturers understand and manage the utilities behind their operations.

Discuss Your Utilities & Cost Analytics Requirements