
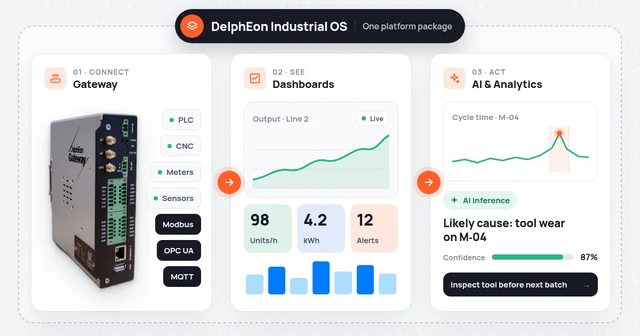
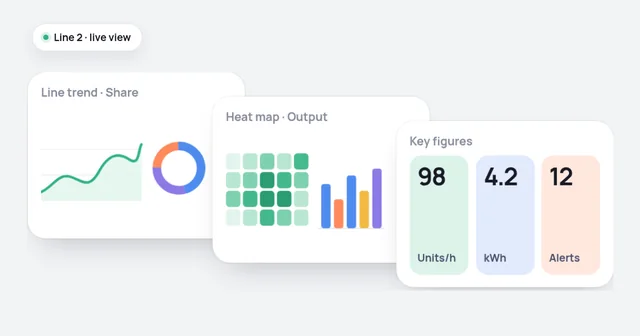
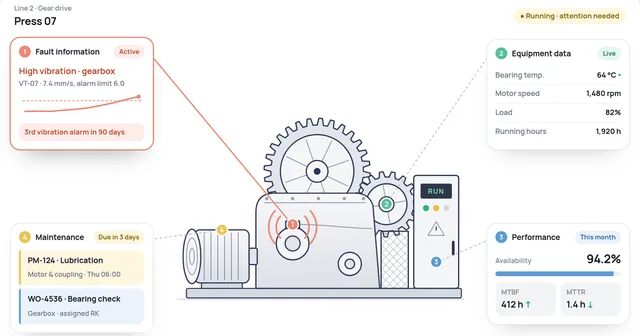
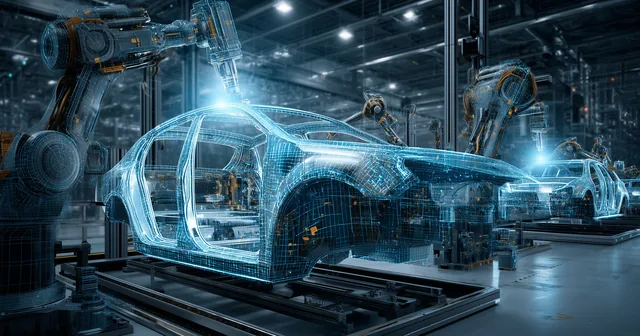




Live operational monitoring
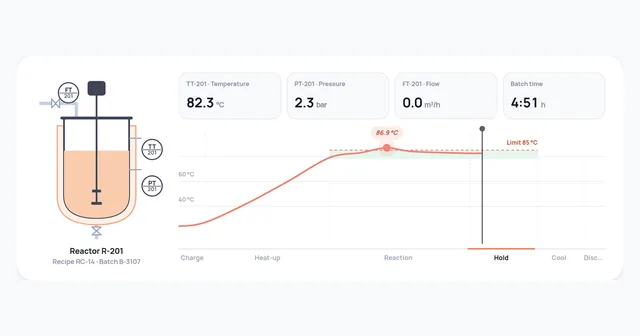
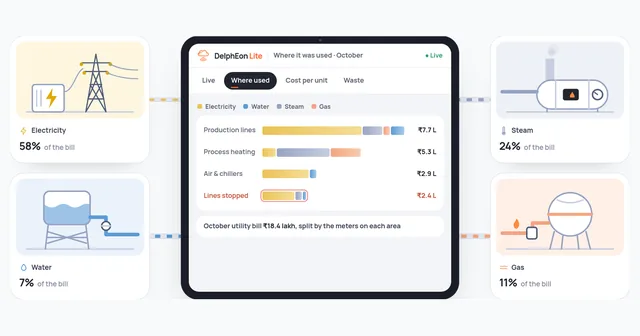
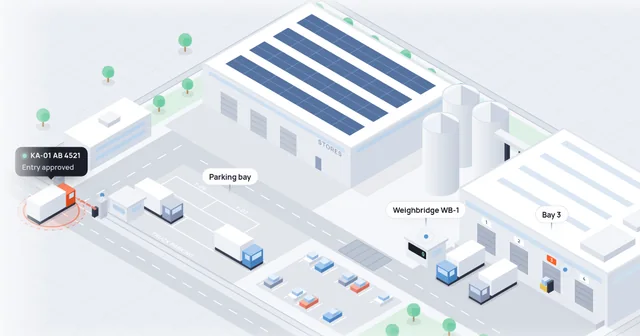
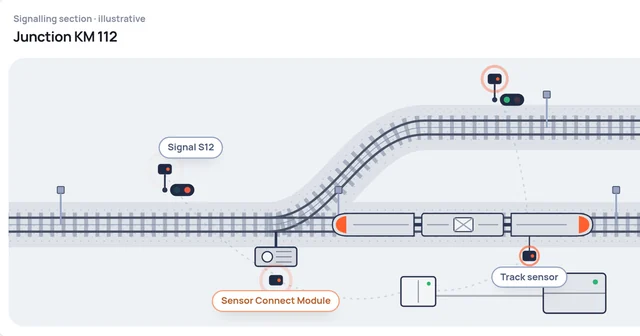
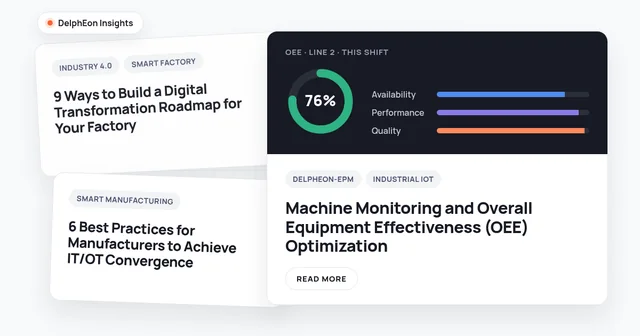
Follow current equipment status, readings and KPIs from connected systems.
Operational data is useful only when people can understand it and respond. DelphEon turns connected plant information into clear dashboards, trends and performance views that help teams stay close to what is happening on the shop floor.
Views for every role
Keep scrolling to see each role’s viewHover or tap a role to see its view
How a reading becomes a KPI
A reading on its own tells only part of the story. DelphEon connects measurements to plants, areas, equipment, processes and the correct time periods so that the information shown in a dashboard has meaning beyond a single number.
EM-203 · meter
4,812.6 kWhraw counter valueAssociate readings, events and parameters with the right assets and operating conditions.
Turn available raw values into useful measures such as consumption, running hours, production totals and performance indicators.
Energy per unit · Line 2
Use contextualized information in live views, trends, reports, alerts and operational workflows.
Views
Follow current equipment status, readings and KPIs from connected systems.
Compare performance across selected dates, shifts or reporting periods.
Bring key measures together at machine, line, area or plant level.
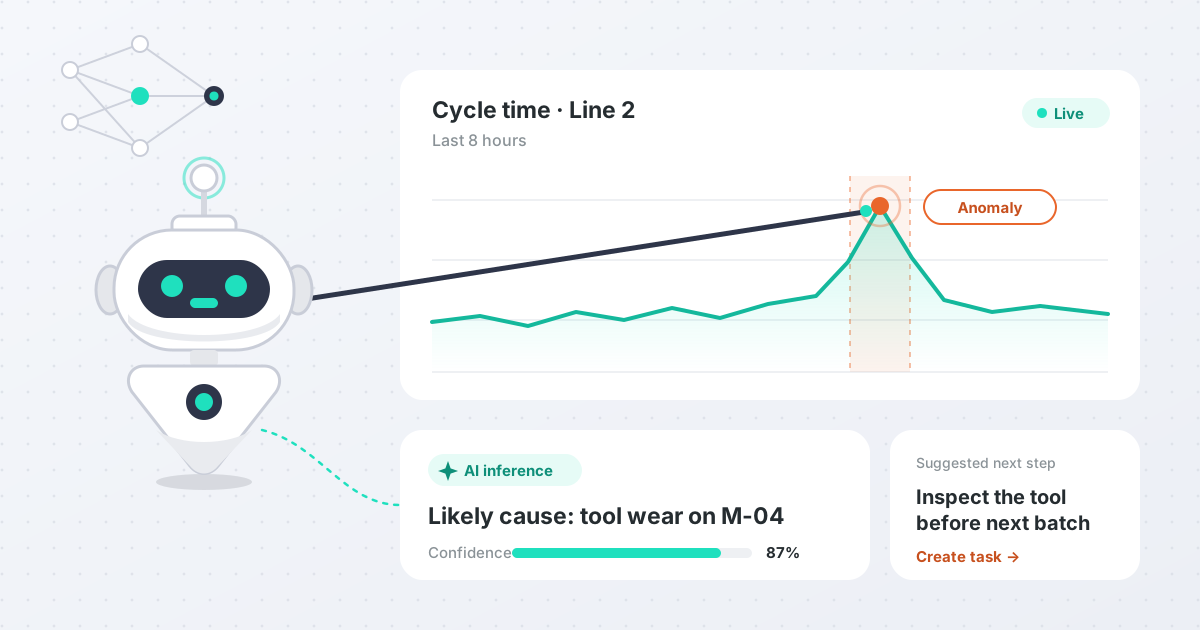
Make threshold breaches, unusual conditions and items requiring review easier to identify.
Present operational information needed for recurring discussions, investigation and follow-up.
Drill down
Start with the whole plant and follow a change down the asset hierarchy, from noticing a problem to knowing exactly where to investigate it.
Keep scrolling to drill down a levelHover or tap a level to drill in
Asset hierarchy
One set of measures
Production, quality, maintenance, energy and process teams may work with overlapping operational information. Bringing the right views together helps them review a common set of measures, focus discussions and connect observations with structured follow-up actions.
Show us the KPIs, reports and operating views your team needs. We can demonstrate how they could be brought together in DelphEon.
Request a Platform Demo